Atlas Visualization
“Atlas” is an internal database of Full Sail University’s degree programs, as well as their courses, instructors, required materials, and assignments. The database was created and is maintained by Full Sail’s own Academic Innovation team, who reached out to me and two other students to help them create a visualization of their data. We worked hard during our six month work-study, and this is what we have to show.
Tools Used
Here are some of the tools we used to accomplish our goal
Challenges
Here are a few challenges I was tasked to solve during the project
Live Database Interactions
One of the first challenges we faced early on in the project was the idea of having the Atlas database feed our simulation in real time. In the beginning we were using simple excel tables exported from the database to feed our simulation, but with the ever-growing nature of the full data set we needed something better. My team and I came up with a few ideas, but we decided to choose interacting with the MySQL database directly through C# scripts in Unity.
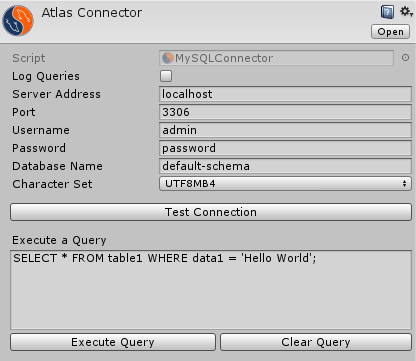
My job was to design and implement a wrapper around Oracle’s MySQL library Connector/Net. In my implementation I chose to focus on extending Unity’s Editor functionality, allowing my team, or any other people working on the project in the future, to easily manipulate connection settings or even have multiple connections through a custom editor script. Under the hood I also designed and implemented a builder-style query maker, which allowed the other programmers on my team to easily chain together different MySQL commands and get the data they wanted from Atlas with only a few lines of code.

Real Time Physics Manipulations
As soon as the database communication was setup we all of a sudden had thousands of data points flowing in with no way to visualize them. My next job was to determine how to simulate a force-directed layout on potentially thousands of nodes, which could change and be moved in real time. Our goal was to use a physics based force-directed graph which would manipulate the positioning of the data nodes into a way where patterns in the data set would make themselves apparent. My idea was to implement a version of the Barnes-Hut algorithm, the same algorithm used to simulate large galaxies with millions of data points, all in parallel over the available processors on the machine. This was accomplished by using the mediator design pattern, which allowed Unity’s components to communicate to the worker threads. This proved to be very successful, as we were able to simulate just over 1000 data points and over 11,000 connections.
Filming Mixed Reality with the ZED Camera
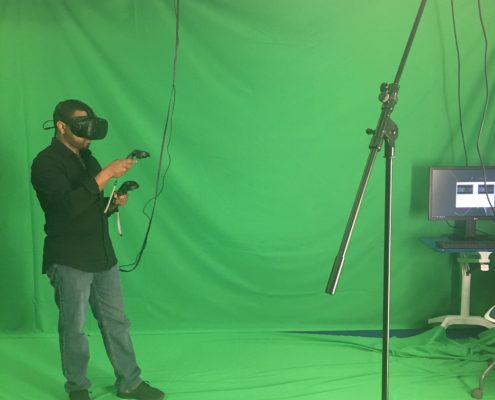
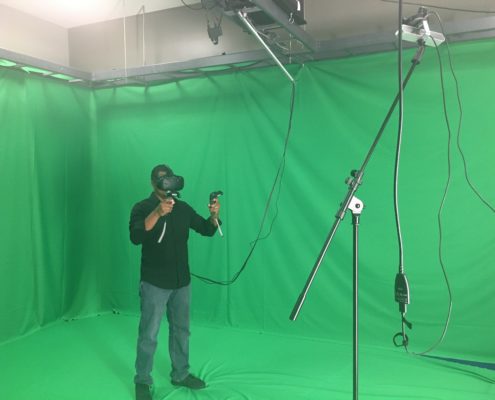
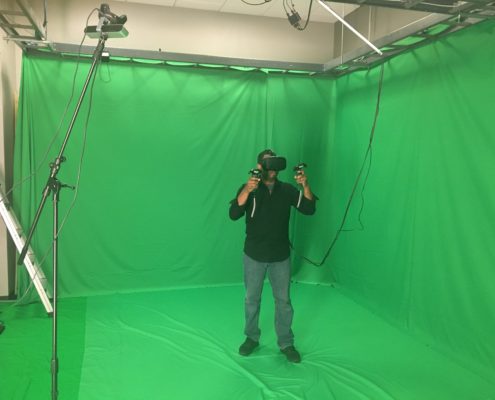
Designing and creating a visualization is one thing, but showing it off is what makes it effective. We decided to use the ZED Camera, a depth sensing camera, attached to a Vive Tracker. This allowed us to use a green screen and sync up both the in-game footage of our visualization, as well as record the person using it. This makes it seem as if the person is truly surrounded by the virtual objects, which helped us portray the immense size of Atlas’s database.


